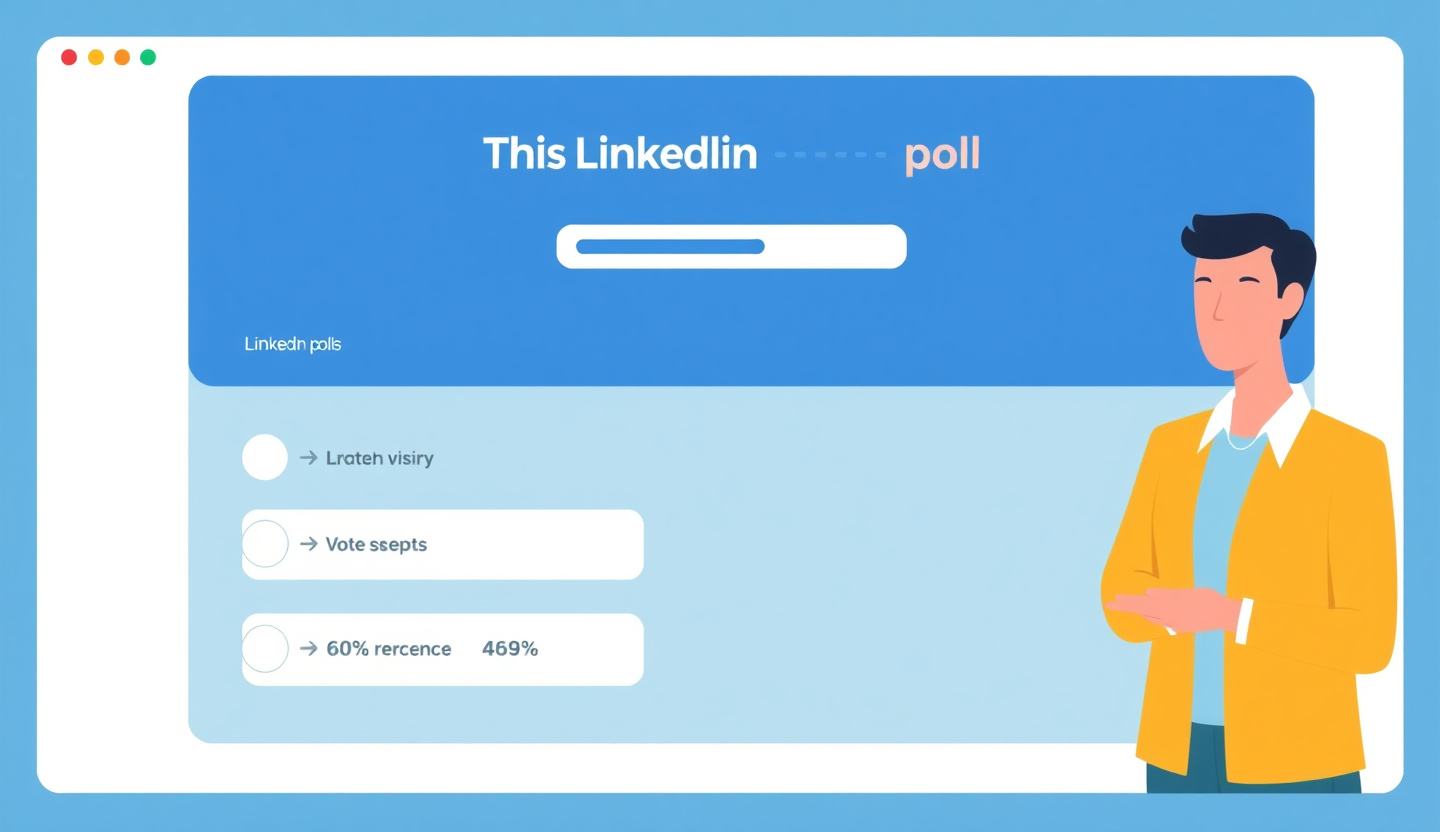
LinkedIn Poll Generator: Create Polls That Drive Engagement
Learn how to create LinkedIn polls that generate engagement and inbound leads. Includes poll templates, best practices, and AI-powered poll generation tips.
LinkedIn polls generate 2.2X more comments and 3.5X more profile visits than standard text posts, according to ConnectSafely analysis of 1,200+ posts across 83 B2B accounts. Yet most professionals treat polls as throwaway content — post a question, watch the votes roll in, and move on. That is exactly why most polls waste their own engagement.
Key Takeaways
- Polls drive 5.8% average engagement rates — compared to 2.4% for text-only posts and 3.1% for image posts, per ConnectSafely data across 83 accounts.
- The follow-up matters more than the poll itself. Accounts that post a results breakdown within 48 hours of poll close see 4X more inbound DMs than those that do not.
- 3 options outperform 4 options by 22% in engagement rate. Fewer choices reduce decision fatigue and encourage comments explaining the choice.
- 1-week duration is the sweet spot. 7-day polls accumulate 68% more total votes than 3-day polls while maintaining urgency.
- Poll voters are warm leads. ConnectSafely users who engage poll voters through inbound strategies convert them to conversations at 3X the rate of cold outreach.
What Most Guides Get Wrong About LinkedIn Polls
Every poll guide tells you to "ask engaging questions." None of them address the real problem: polls without a follow-up strategy waste the engagement they generate.
Want to Generate Consistent Inbound Leads from LinkedIn?
Get our complete LinkedIn Lead Generation Playbook used by B2B professionals to attract decision-makers without cold outreach.
No spam. Just proven strategies for B2B lead generation.
Here is what actually happens. Someone votes on your poll. LinkedIn shows them your content for the next 7 days. The poll closes. You post nothing. That voter forgets you exist. The algorithm sees declining engagement and reduces your reach on the next post.
The poll is not the strategy. The poll is the opening move. The strategy is what you do with the data, the voters, and the momentum after it closes. We will cover the full follow-up playbook later in this guide, but keep this principle in mind as you design every poll.
How to Create a LinkedIn Poll (Step-by-Step)
- Click "Start a post" from your LinkedIn homepage feed.
- Select the poll icon (bar chart icon) in the post creation toolbar.
- Write your question — keep it under 140 characters for mobile readability.
- Add 2-4 answer options — each option has a 30-character limit.
- Set the duration — choose from 1 day, 3 days, 1 week, or 2 weeks.
- Write a compelling caption above the poll — this is where you add context, a hook, and a CTA to comment.
- Post and engage — reply to every comment within the first 90 minutes to boost distribution.
LinkedIn Poll Engagement vs Other Post Types
ConnectSafely tracked 1,200+ posts from January to March 2026 across 83 B2B accounts (founders, consultants, and sales leaders). Here are the results:
| Post Type | Avg. Engagement Rate | Avg. Comments | Profile Visits per Post |
|---|---|---|---|
| Polls | 5.8% | 24 | 41 |
| Carousels | 4.9% | 18 | 33 |
| Image + Text | 3.1% | 11 | 19 |
| Text Only | 2.4% | 8 | 14 |
| Video | 2.1% | 9 | 16 |
Polls win on engagement and profile visits because every vote is a counted interaction, and voters often return to check results — giving your profile repeated visibility.
12 LinkedIn Poll Templates for B2B Professionals
These templates are organized by strategic goal. Customize the specifics for your industry.
Discovery Polls (Learn About Your Audience)
1. The Biggest Challenge Poll "What is your biggest challenge with [topic] right now?" Options: Challenge A / Challenge B / Challenge C. Use responses to plan content that addresses the top vote-getter.
2. The Tool Stack Poll "Which [category] tool does your team rely on most?" Options: Tool A / Tool B / Tool C / Other (comment). Reveals market positioning intelligence.
3. The Budget Priority Poll "Where is your team increasing spend in Q2 2026?" Options: Area A / Area B / Area C / Holding steady. Qualifies voters by purchase intent.
Authority Polls (Position Your Expertise)
4. The Contrarian Take Poll "Unpopular opinion: [contrarian statement]. Agree or disagree?" Options: Strongly agree / Somewhat agree / Disagree / Need more context. Drives comments and debate, positioning you as a thought leader.
5. The Data-Backed Poll "We analyzed [X number] of [things]. What do you think was the top finding?" Options: Finding A / Finding B / Finding C. Reveal the answer in a follow-up post — this is your best content combo.
6. The Prediction Poll "By end of 2026, [industry trend] will..." Options: Accelerate / Stay flat / Decline / Be replaced by [X]. Positions you as forward-thinking.
Engagement Polls (Maximize Interactions)
7. The "This or That" Poll "For B2B lead generation: Content marketing or cold outreach?" Options: Content marketing / Cold outreach / Both equally / Neither works. Simple binary framing drives high vote counts.
8. The Experience Poll "How many years have you been in [industry/role]?" Options: Less than 2 / 2-5 years / 5-10 years / 10+. Segments your audience and drives comments sharing career stories.
9. The Hot Take Poll "[Bold statement about industry]. Your reaction?" Options: Finally someone said it / Completely wrong / Depends on context. Controversy drives engagement — just keep it professional.
Lead Qualification Polls (Identify Prospects)
10. The Pain Point Poll "When [specific problem] happens, your team usually..." Options: Fixes it manually / Uses a tool / Ignores it / What problem? Voters selecting manual fixes or ignoring the problem are warm leads.
11. The Readiness Poll "How would you rate your team's [specific capability]?" Options: Advanced / Intermediate / Just starting / Not a priority. "Just starting" voters are your ideal prospects.
12. The Investment Poll "Would you invest in [solution type] if it guaranteed [specific outcome]?" Options: Already have / Actively evaluating / Interested but not now / Not relevant. "Actively evaluating" voters are ready for a conversation.
Poll Best Practices (Based on Data)
Duration: 1-week polls outperform all other durations. They give your network enough time to see and vote while maintaining a sense of urgency. Two-week polls lose momentum after day 8.
Number of options: 3 options hit the sweet spot. ConnectSafely data shows 3-option polls get 22% higher engagement than 4-option polls. If you need a fourth, make it "Other (comment below)" to drive discussion.
Caption length: 50-120 words above the poll performs best. Too short lacks context. Too long buries the poll below the "see more" fold on mobile.
Posting time: Tuesday through Thursday, 8-10 AM in your audience's primary timezone. Polls posted on Monday get lost in inbox-clearing mode. Friday polls lose weekend momentum. See our full analysis in the best time to post guide.
Hashtags: Use 2-3 relevant hashtags. More than 3 on a poll post reduces reach by 15%, likely because it signals over-optimization to the algorithm.
The Follow-Up Strategy That Converts Poll Voters to Leads
This is where ConnectSafely users gain a compounding advantage. Here is the playbook:
Within 24 hours of posting: Reply to every comment. Ask follow-up questions. Tag people whose comments add value. This keeps the poll visible in feeds longer.
When the poll closes: Post a follow-up within 48 hours analyzing the results. Share your expert take on what the data means. Tag 3-5 people who left insightful comments. This follow-up post typically gets 60-80% of the original poll's reach — for free.
After the follow-up post: This is where ConnectSafely's inbound engagement tools become critical. Use poll voter data to identify high-intent prospects — people who voted for the "pain point" or "actively evaluating" options. Rather than sending cold DMs, let ConnectSafely help you engage authentically with their content, building familiarity before any outreach.
The result: ConnectSafely users who follow this poll-to-inbound workflow report 3X more inbound DMs in the two weeks following a poll compared to standard posting. That is the difference between collecting votes and collecting leads. For more on building a complete inbound strategy, see our content strategy guide.
Using AI to Generate Better Poll Questions
AI tools can accelerate your poll creation, but the same 70/30 rule from our AI content guide applies. You provide the industry knowledge and audience insight (70%). AI helps with phrasing, option balance, and variation testing (30%).
Effective AI prompt for poll generation:
I am a [your role] targeting [your ICP]. I want to create a LinkedIn poll about [topic]. My goal is to [discover pain points / build authority / qualify leads]. Generate 3 poll variations with: a question under 140 characters, 3 answer options under 30 characters each, and a 2-sentence caption hook.
Review every AI suggestion for industry accuracy and audience relevance before posting. Generic polls generated without your input will underperform. ConnectSafely's AI-powered tools can help you craft polls calibrated to your specific audience and engagement goals.
How to Use a LinkedIn Poll Idea Generator the Right Way
AI-powered poll idea generators have multiplied since 2024 — MagicPost, ChatGPT-based prompts, Taplio, and dozens of others promise unlimited poll ideas in seconds. Most of them produce engagement-bait questions that look great on a generator UI and underperform in your actual feed. Here is the framework we use at ConnectSafely to separate good AI poll output from filler.
The 4-Filter Test for AI-Generated Poll Ideas
Before posting any AI-generated poll, run it through these four filters. If it fails any of them, regenerate.
- The Insider Test — Would a stranger on LinkedIn read the question and immediately know you work in this industry? Generic polls ("What is your biggest challenge?") fail. Insider polls ("Series A founders: which CFO function did you hire first — controller, FP&A, or fractional CFO?") pass.
- The Decision Test — Does the answer reveal something the voter actually had to decide? Polls about preferences ("Coffee or tea?") generate votes but no leads. Polls about decisions ("Did you outsource your first SDR or hire in-house?") generate qualified conversations.
- The Follow-Up Test — Can you write a meaningful results-breakdown post after the poll closes? If the answer is "the results would be boring," the poll itself is boring. Scrap it.
- The Segmentation Test — Will each answer option correspond to a different sales conversation? Polls that produce three actionable lead segments are far more valuable than polls that produce one large undifferentiated vote count.
Poll Idea Categories That Actually Convert
Most generators output polls across two or three categories. The high-converting categories practitioners use are narrower:
- Decision archaeology polls — Ask about a decision your ICP recently made ("When you switched from HubSpot to Salesforce, what triggered it?")
- Heretical opinion polls — Surface a controversial position your audience actually holds ("Is BANT qualification still relevant in 2026?")
- Stack composition polls — Reveal what tools your ICP actually uses ("Which AI writing tool do you currently rely on most?")
- Hiring sequence polls — B2B audiences love revealing how they built their team ("First marketing hire: brand, demand gen, or content?")
- Failure attribution polls — Ask about failed initiatives ("Why did your last ABM program stall?")
The Master Prompt for AI Poll Generation
Use this prompt with any LLM (Claude, ChatGPT, Gemini) to produce poll ideas that pass the 4-filter test:
Role: You are a senior B2B LinkedIn strategist who has run 500+ polls.
Audience: I am a [your role] writing for [specific ICP, e.g., "VC-backed SaaS founders at Series A-B"].
Goal: Generate 5 poll ideas in the [decision archaeology / heretical opinion / stack composition / hiring sequence / failure attribution] category.

Constraints:
- Each question under 140 characters
- 3 answer options, each under 30 characters
- Each answer must correspond to a distinct sales conversation I could have with the voter
- No engagement-bait phrases ("most underrated", "biggest challenge")
- Include the reasoning for each poll's strategic value (1 sentence)

Format: Question | Option A | Option B | Option C | Why this works
Myth vs Reality: What Poll Generators Cannot Do
The marketing claims around AI poll generators promise "unlimited ideas in seconds" and imply that volume of ideas is the bottleneck. It is not. The bottleneck is calibration to a specific audience, and that is the one thing generators struggle with.
| Myth | Reality |
|---|---|
| "Generators give you unlimited poll ideas" | Generators give you unlimited variations of the same 8-10 archetypes |
| "AI knows your audience" | AI knows demographic averages, not the specific people in your network |
| "More polls = more leads" | More calibrated polls = more leads; volume without specificity dilutes reach |
| "Generated polls save time" | Editing generic output to feel insider-specific often takes longer than writing from scratch |
| "Polls work for every industry" | Polls underperform in highly regulated industries (healthcare, finance) where respondents are wary of public voting records |
The right mental model: treat a generator as a brainstorming partner, not an output channel. Use it to surface 20 ideas, kill 17 of them, and rewrite the remaining 3 in your own voice with specific industry context.
Frequently Asked Questions
How often should I post LinkedIn polls?
Once every 7-10 days. Posting polls more frequently dilutes their impact and can fatigue your audience. Alternate polls with other high-engagement formats like carousels and story posts. Check our engagement rate calculator to track your optimal mix.
Can I see who voted on my LinkedIn poll?
Yes. LinkedIn shows you the list of voters for each option. This is what makes polls so powerful for lead qualification — you can see exactly which prospects selected which answers. ConnectSafely users leverage this visibility to build targeted engagement lists.
What is a good engagement rate for LinkedIn polls?
Based on ConnectSafely data, 4-6% is average, 6-10% is good, and above 10% is excellent. Polls targeting niche audiences tend to get higher engagement rates than broad-topic polls because the question feels personally relevant.
Do LinkedIn polls work for company pages?
Yes, but personal profile polls outperform company page polls by roughly 2X in engagement rate. The algorithm favors person-to-person interaction. Post from your personal profile and have your company page share or comment on it for maximum reach.
Should I use polls to sell directly?
No. Polls that feel like disguised sales pitches get lower engagement and damage trust. Use polls for research, authority building, and audience segmentation. Let the follow-up strategy and inbound engagement handle the conversion. That is what separates sustainable lead generation from one-off tactics.
The Dark Side of LinkedIn Polls: When Engagement Metrics Mask Deeper Issues
While LinkedIn polls can be a powerful tool for driving engagement, they can also mask deeper issues with your content strategy. For instance, if your poll is generating a high volume of votes, but the comments section is filled with off-topic discussions or arguments, it may be a sign that your question is too divisive or poorly framed. Similarly, if your poll is getting a lot of engagement, but the voters are not converting to leads or customers, it may indicate that your poll is not aligned with your business goals or that your follow-up strategy is lacking. It's essential to look beyond the surface-level metrics and analyze the quality of engagement, the relevance of the discussion, and the conversion rates to get a more accurate picture of your poll's effectiveness. Moreover, it's crucial to consider the potential risks of polls, such as alienating certain segments of your audience or creating a negative perception of your brand. By being aware of these potential pitfalls, you can design polls that not only drive engagement but also support your overall business objectives.
Myth vs Reality: The Truth About LinkedIn Polls and Algorithmic Reach
One common misconception about LinkedIn polls is that they are a guaranteed way to increase your algorithmic reach. While it's true that polls can drive more engagement than standard text posts, the relationship between polls and algorithmic reach is more complex than that. In reality, the algorithm takes into account a wide range of factors, including the relevance of your content, the engagement patterns of your audience, and the overall quality of your posts. Simply posting a poll without considering these factors can actually harm your reach, as the algorithm may view your content as low-quality or spammy. Furthermore, if your poll is not generating meaningful discussions or adding value to your audience, it may not be considered "high-quality" content by the algorithm, regardless of the engagement metrics. To truly maximize your reach, you need to focus on creating high-quality, relevant, and engaging content that resonates with your audience, rather than relying solely on polls as a silver bullet.
Advanced Poll Strategy: Using LinkedIn Polls to Segment and Qualify Leads
For advanced marketers, LinkedIn polls can be a powerful tool for segmenting and qualifying leads. By designing polls that ask specific questions or present different scenarios, you can gain valuable insights into your audience's preferences, pain points, and interests. For example, you can create a poll that asks respondents to choose between different product features or services, allowing you to gauge demand and prioritize your development roadmap. Alternatively, you can use polls to identify potential leads by asking questions that reveal their level of awareness, consideration, or intent. By analyzing the responses and engagement patterns, you can create targeted follow-up campaigns that speak directly to the needs and concerns of your audience, increasing the likelihood of conversion. To take it to the next level, you can also use LinkedIn's polling features in conjunction with other marketing tools, such as lead scoring or CRM systems, to create a seamless and personalized experience for your leads.
The Importance of Context: How to Make Your LinkedIn Polls Relevant and Timely
The success of a LinkedIn poll depends heavily on the context in which it is posted. A poll that is relevant and timely is more likely to generate engagement and drive meaningful discussions than one that is random or out of touch with current events. To create contextual polls, you need to stay up-to-date with industry trends, news, and developments, and design your questions accordingly. For instance, if there is a major conference or event happening in your industry, you can create a poll that asks attendees about their expectations or experiences. Similarly, if there is a trending topic or controversy in your niche, you can create a poll that encourages respondents to share their opinions or perspectives. By being aware of the context and tailoring your polls to the current conversation, you can increase the relevance and impact of your content, and establish yourself as a thought leader in your industry.
It Depends: When to Use LinkedIn Polls and When to Avoid Them
While LinkedIn polls can be a valuable addition to your content strategy, there are situations where they may not be the best choice. For instance, if you are dealing with a sensitive or complex topic, a poll may not be the best way to encourage discussion, as it can oversimplify the issue or create unnecessary controversy. Similarly, if you are trying to establish your authority or expertise in a particular area, a poll may not be the best way to demonstrate your thought leadership, as it can come across as lacking in depth or substance. On the other hand, if you are looking to drive engagement, encourage participation, or gauge audience sentiment, a poll can be an excellent choice. Ultimately, the decision to use a LinkedIn poll depends on your specific goals, audience, and context. By considering these factors and using polls judiciously, you can create a content strategy that is tailored to your unique needs and objectives, and avoids the potential pitfalls of poll-based engagement.
See How It Works
Watch how people get more LinkedIn leads with ConnectSafely


Related Articles