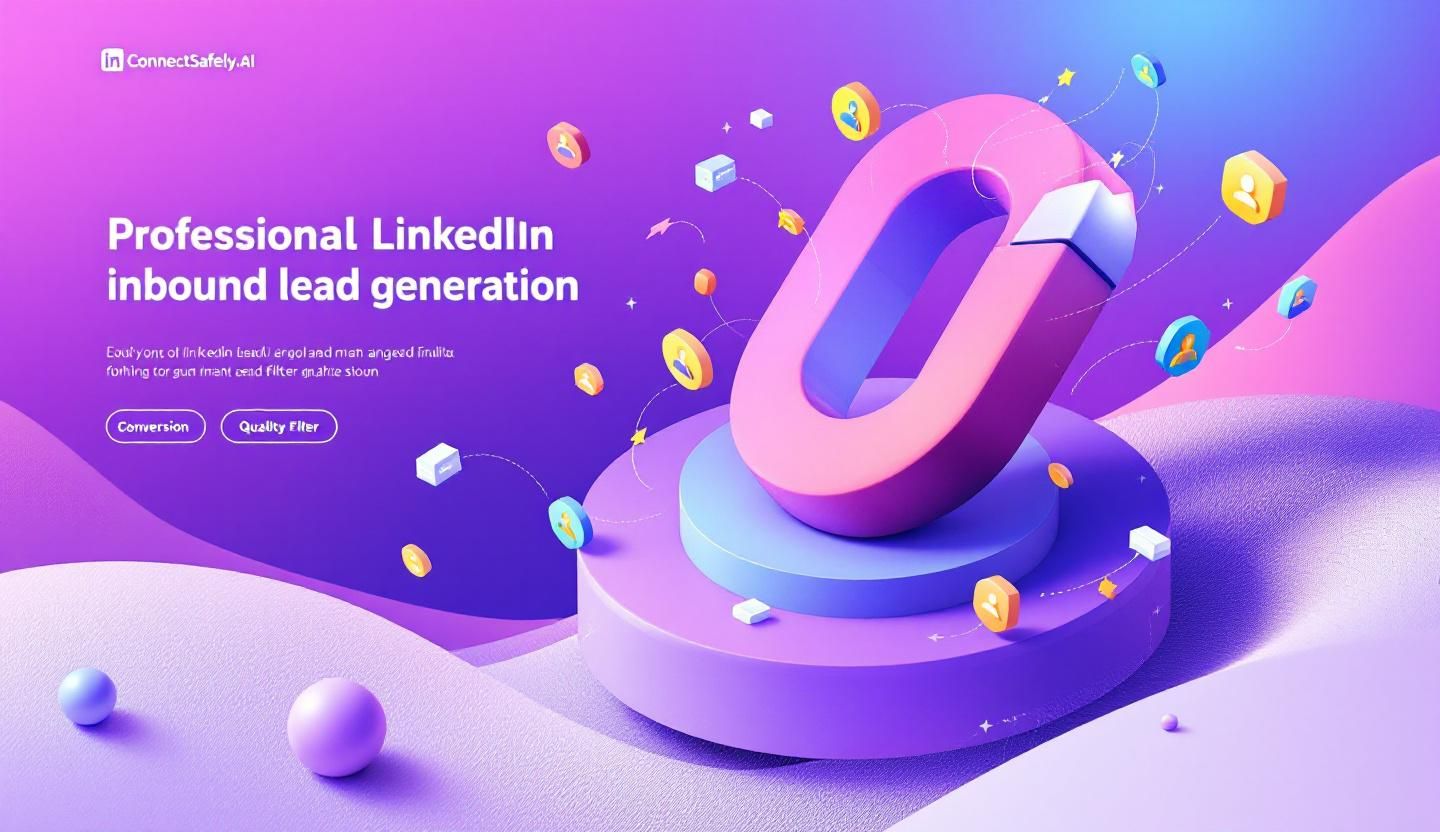
15 Sales Metrics & KPIs That Actually Matter in 2026
Track the right sales metrics in 2026. Learn which KPIs drive revenue, how to measure them, and why LinkedIn inbound leads outperform on every metric.
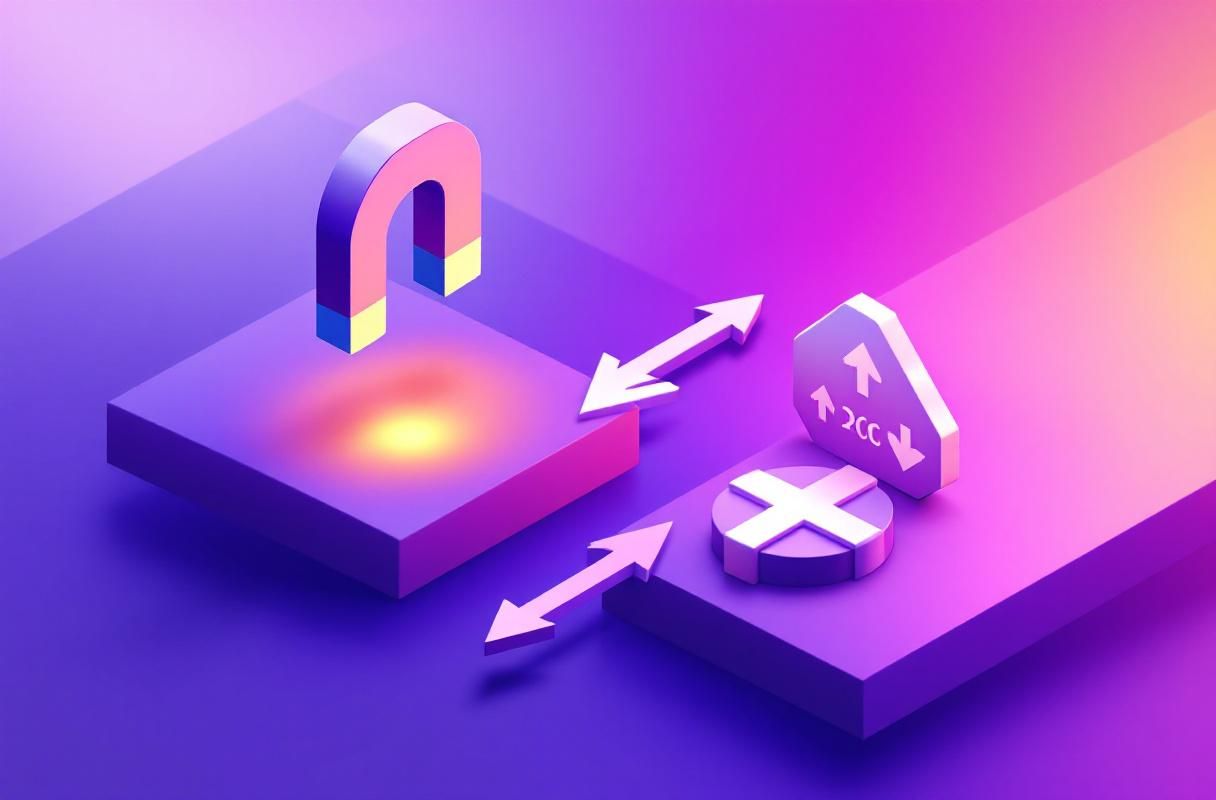
Sales teams track dozens of metrics. Dashboards overflow with charts, percentages, and trend lines. Yet most teams still miss their number — because they measure everything except what moves revenue.
The problem is not a lack of data. It is a lack of focus. In 2026, the sales teams winning consistently are the ones tracking 15 specific metrics — and feeding them with LinkedIn inbound leads that outperform on every single one.
Want to Generate Consistent Inbound Leads from LinkedIn?
Get our complete LinkedIn Lead Generation Playbook used by B2B professionals to attract decision-makers without cold outreach.
No spam. Just proven strategies for B2B lead generation.
Key Takeaways
- Only 15 metrics matter for predicting and improving sales performance in 2026
- Inbound leads convert at 14.6% compared to 1.7% for outbound, per HubSpot, lifting nearly every downstream metric
- Sales cycle length drops 40–60% when prospects arrive pre-educated through LinkedIn authority content
- Cost per lead falls to $15–50 with inbound versus $150–400 for cold automation, according to ConnectSafely benchmarks
- Pipeline velocity is the single most underrated KPI — and inbound improves all four of its variables simultaneously
What Most Guides Get Wrong About Sales Metrics
Most sales metrics guides treat every KPI as equally important. They list 30 or 40 metrics, give you a definition, and move on. That approach creates two problems.
First, it encourages vanity tracking. Teams celebrate high activity metrics — calls made, emails sent, meetings booked — without connecting them to revenue outcomes. Activity is not a result.
Second, it ignores the source quality problem. A 20% close rate means nothing if you do not know whether those leads came from inbound content, cold outreach, or paid ads. The same metric behaves completely differently depending on lead origin.
The metrics below are organized by what they actually predict: revenue efficiency, pipeline health, and team performance. And for each one, we show how LinkedIn inbound leads shift the benchmark in your favor.
The 15 Sales Metrics That Drive Revenue in 2026
The Complete Metrics Reference Table
| # | Metric | Definition | 2026 Benchmark | Why It Matters |
|---|---|---|---|---|
| 1 | Conversion Rate | Percentage of leads that become customers | 2–5% (blended); 14.6% inbound | Directly measures funnel efficiency |
| 2 | Close Rate | Percentage of proposals/quotes that close | 20–30% | Reveals sales execution quality |
| 3 | Average Deal Size | Mean revenue per closed deal | Industry-dependent | Determines revenue per effort |
| 4 | Sales Cycle Length | Days from first contact to closed-won | 60–120 days B2B | Predicts cash flow timing |
| 5 | Cost Per Lead (CPL) | Total spend divided by leads generated | $15–50 inbound; $150–400 outbound | Controls acquisition economics |
| 6 | Customer Acquisition Cost (CAC) | Total sales + marketing cost per new customer | $200–400 inbound; $3,000–8,000 outbound | The true cost of growth |
| 7 | Customer Lifetime Value (LTV) | Total revenue from a customer over their lifetime | 3–5x CAC minimum | Validates acquisition spending |
| 8 | Pipeline Velocity | Speed at which revenue moves through your pipeline | Varies by org | The single best health indicator |
| 9 | Win Rate | Percentage of qualified opportunities closed-won | 15–25% average | Measures competitive positioning |
| 10 | Churn Rate | Percentage of customers lost per period | 5–7% annual B2B | Reveals product-market fit gaps |
| 11 | Quota Attainment | Percentage of reps hitting their number | 53% industry average | Indicates target-setting accuracy |
| 12 | Revenue Per Rep | Total revenue divided by sales headcount | $500K–$1.2M annually | Measures team productivity |
| 13 | Lead Response Time | Minutes/hours to first response after lead creation | Under 5 minutes ideal | Speed-to-lead directly impacts close rate |
| 14 | Lead-to-Opportunity Ratio | Percentage of leads that become qualified opportunities | 10–15% outbound; 25–40% inbound | Measures lead quality at entry |
| 15 | Monthly Recurring Revenue (MRR) | Predictable monthly revenue from subscriptions | Growth-stage dependent | The north star for SaaS and subscription models |
1. Conversion Rate
Conversion rate measures the percentage of leads that ultimately become paying customers. It is the single most revealing metric because it reflects the quality of everything upstream — lead source, messaging, qualification, and sales execution.
The industry blended average sits at 2–5%. But that number hides a massive disparity. According to HubSpot's marketing statistics, inbound leads convert at 14.6% versus 1.7% for outbound. The source determines the outcome.
LinkedIn inbound leads convert higher because prospects have already consumed your content, understand your expertise, and self-selected to engage. They arrive pre-convinced. Learn more about these benchmarks in our LinkedIn lead conversion rate analysis.
2. Close Rate
Close rate narrows the lens to the bottom of your funnel: of the deals you actually propose or quote, what percentage closes? A healthy B2B close rate ranges from 20–30%.
When leads arrive through LinkedIn inbound, close rates climb because the trust-building happened before the sales conversation. Prospects who have read your posts, seen your comments, and visited your profile do not need convincing — they need a proposal.
3. Average Deal Size
Average deal size is your mean revenue per closed deal. It determines whether your sales effort is commercially viable at your current cost structure.
Inbound leads tend to produce 15–30% larger deals. Prospects who view you as a thought leader are less price-sensitive and more open to expanded solutions. Companies using social selling strategies see up to 48% larger deals.
4. Sales Cycle Length
The average B2B sales cycle runs 60–120 days. That is a long time to carry pipeline risk, pay sales salaries, and wait for revenue recognition.
LinkedIn inbound compresses the cycle by 40–60%. When prospects arrive already educated about your approach and convinced of your authority, they skip the early research stages. Conversations start at solution fit rather than problem awareness. For the full breakdown, see our B2B sales process guide.
5. Cost Per Lead (CPL)
CPL measures what you spend to generate each lead. The gap between inbound and outbound is staggering: $15–50 for LinkedIn inbound versus $150–400 for cold automation tools.
But CPL alone misleads. A $5 cold lead that converts at 1.7% costs far more per customer than a $30 inbound lead converting at 14.6%. Always pair CPL with conversion rate. Our CPL benchmarks guide covers this in detail.
6. Customer Acquisition Cost (CAC)
CAC captures the total cost of acquiring a customer — including sales salaries, tools, marketing spend, and overhead. It is the honest version of CPL.
Inbound-driven teams typically run CAC of $200–400 per customer. Cold-driven teams see $3,000–8,000 or more. The math is straightforward: lower CPL multiplied by higher conversion equals dramatically lower CAC.
7. Customer Lifetime Value (LTV)
LTV represents the total revenue you can expect from a customer across their entire relationship with your company. The standard target is an LTV-to-CAC ratio of at least 3:1.
Inbound customers tend to have 20–30% higher LTV because they arrived with aligned expectations. They understood what you offered before they bought, reducing the mismatch that drives early churn.
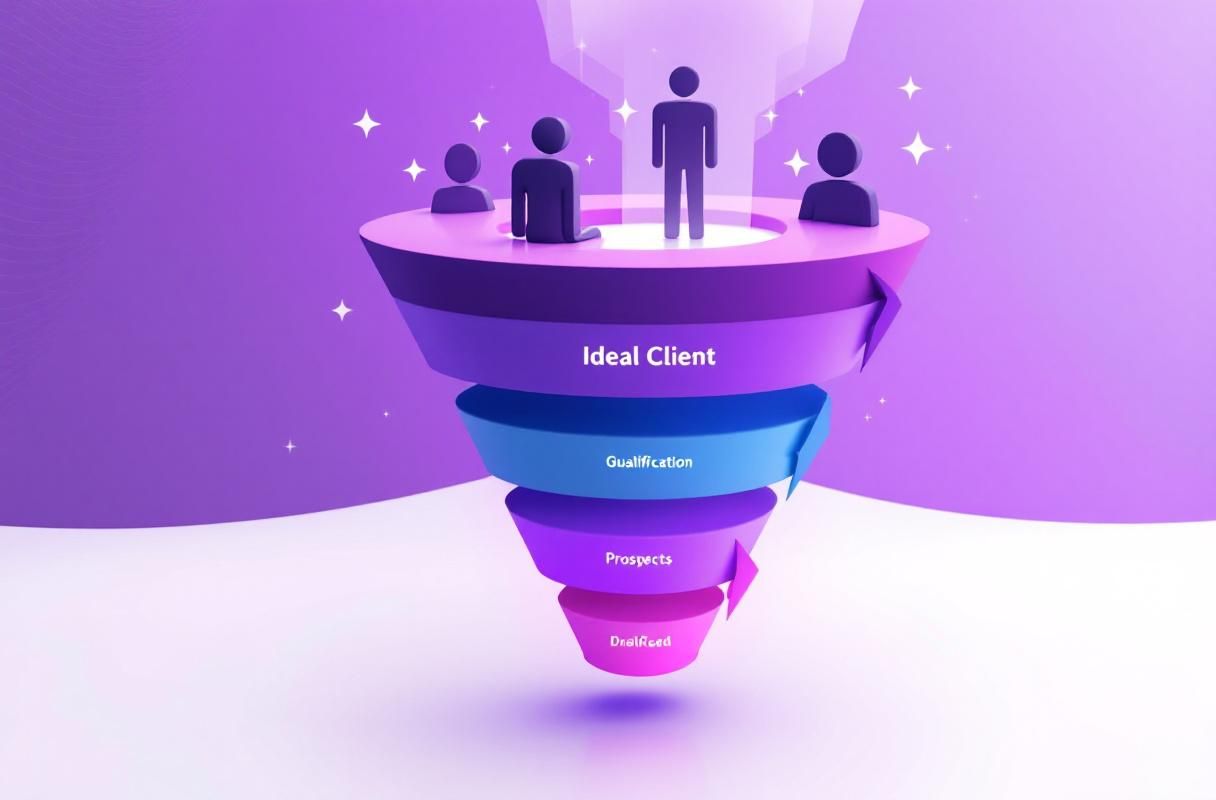
8. Pipeline Velocity
Pipeline velocity is calculated as: (Number of Opportunities x Average Deal Size x Win Rate) / Sales Cycle Length. It measures the dollar value flowing through your pipeline per day.
This is the most underrated metric in sales. LinkedIn inbound improves all four variables simultaneously — more qualified opportunities, larger deals, higher win rates, and shorter cycles. No other lead source touches all four levers. Explore how to build and manage this in our pipeline management guide.
9. Win Rate
Win rate tracks the percentage of qualified opportunities you close against competitors. The average hovers around 15–25%, meaning most deals are lost.
When you have LinkedIn authority, you enter competitive deals with a built-in advantage. Prospects already trust your expertise. 92% of B2B buyers engage with salespeople who are known industry thought leaders.
10. Churn Rate
Churn rate measures how many customers you lose over a given period. Average B2B annual churn sits at 5–7%, but poorly sourced customers churn at 2–3x this rate.
Inbound customers churn less because they had realistic expectations from your content. They did not buy based on a persuasive cold pitch — they bought based on understanding your actual value proposition.
11. Quota Attainment
Only 53% of sales reps hit quota in 2026. That means nearly half your sales team is underperforming relative to targets.
Teams fed inbound leads see quota attainment rise to 65–75%. Reps spend less time prospecting and more time closing warm opportunities. The bottleneck shifts from lead generation to deal execution.
12. Revenue Per Rep
Revenue per rep divides total team revenue by headcount. It reveals whether you are scaling efficiently or just adding bodies.
Inbound-fed reps produce 30–50% more revenue because they are not burning hours on cold outreach. Their time goes to qualified conversations instead of voicemails and ignored InMails.
13. Lead Response Time
The ideal response time is under 5 minutes. Leads contacted within 5 minutes are 21x more likely to enter the pipeline than those contacted after 30 minutes.
LinkedIn inbound leads often initiate conversation themselves — sending connection requests, commenting on posts, or DMing questions. The "response time" effectively becomes instant because the prospect started the interaction.
14. Lead-to-Opportunity Ratio
This metric tracks what percentage of raw leads become qualified sales opportunities. Outbound typically converts 10–15% of leads to opportunities. Inbound converts 25–40%.
The reason is simple: inbound leads are pre-qualified by their own behavior. Someone who reads your LinkedIn content, visits your profile, and reaches out has already demonstrated intent, budget awareness, and timing alignment.
15. Monthly Recurring Revenue (MRR)
MRR is the predictable monthly revenue from ongoing customer relationships. It is the north star for any subscription or recurring-revenue business model.
Inbound-sourced MRR is more stable because those customers have lower churn rates and higher expansion potential. They understand your product deeply before purchasing, leading to stickier contracts and more upsell opportunities.
Inbound vs. Outbound: How Every Metric Shifts
| Metric | Outbound Benchmark | LinkedIn Inbound Benchmark | Improvement |
|---|---|---|---|
| Conversion Rate | 1.7% | 14.6% | 8.6x higher |
| Close Rate | 15–20% | 25–35% | ~70% higher |
| Average Deal Size | Baseline | +15–30% | Larger deals |
| Sales Cycle Length | 90–120 days | 35–60 days | 40–60% shorter |
| Cost Per Lead | $150–400 | $15–50 | 75–90% lower |
| Customer Acquisition Cost | $3,000–8,000 | $200–400 | 85–95% lower |
| Customer Lifetime Value | Baseline | +20–30% | Higher retention |
| Pipeline Velocity | Baseline | 3–5x faster | All variables improve |
| Win Rate | 10–15% | 25–35% | 2–3x higher |
| Churn Rate | 10–15% annual | 4–6% annual | 50–60% lower |
| Quota Attainment | 45–53% | 65–75% | 30–40% higher |
| Revenue Per Rep | Baseline | +30–50% | More selling time |
| Lead Response Time | Hours–days | Minutes (prospect-initiated) | Near-instant |
| Lead-to-Opportunity Ratio | 10–15% | 25–40% | 2–3x higher |
| MRR Stability | Moderate | High | Lower churn compounds |
The pattern is clear: inbound leads do not just improve one or two metrics. They shift the entire system. When prospects arrive pre-educated and pre-trusting, every downstream metric benefits.
How to Track These Metrics Effectively
Tracking 15 metrics does not mean building 15 dashboards. Organize your reporting into three tiers.
Tier 1 — Weekly review: Pipeline velocity, lead response time, lead-to-opportunity ratio. These are leading indicators that predict future revenue.
Tier 2 — Monthly review: Conversion rate, close rate, win rate, CPL, CAC. These are lagging indicators that confirm your strategy is working.
Tier 3 — Quarterly review: Average deal size, sales cycle length, LTV, churn rate, quota attainment, revenue per rep, MRR. These are strategic indicators that guide planning and hiring decisions.
The key is segmenting every metric by lead source. A blended conversion rate of 5% might hide a 14% inbound rate and a 2% outbound rate. Without segmentation, you cannot make informed investment decisions. For a deeper look at ROI tracking by channel, see our inbound ROI metrics guide.
Building a LinkedIn Inbound Engine That Lifts Every Metric
Understanding the metrics is step one. Improving them requires a system.
Step 1: Build authority through consistent content. Post 3–5 times per week on LinkedIn with insights, frameworks, and data relevant to your buyers' challenges. This creates the awareness and trust that drive inbound leads.
Step 2: Engage strategically on target accounts. Comment on posts from decision-makers in your ideal customer profile. This puts your name and expertise in front of buyers before they need your solution.
Step 3: Automate engagement at scale. Manual engagement is powerful but limited. ConnectSafely.ai automates LinkedIn interactions — likes, comments, profile visits — so you maintain consistent visibility without burning hours per day.
Step 4: Track source-segmented metrics. Tag every lead by source in your CRM. Compare inbound versus outbound performance across all 15 metrics monthly. Let the data guide your resource allocation.
Step 5: Double down on what works. When inbound metrics outperform — and they will — shift budget and headcount from cold prospecting to content creation and engagement automation.
Frequently Asked Questions
What are the most important sales metrics for B2B teams to track in 2026?
The five most critical sales metrics for B2B teams in 2026 are pipeline velocity, conversion rate, customer acquisition cost (CAC), sales cycle length, and win rate. Pipeline velocity is the single most comprehensive KPI because it incorporates opportunity count, deal size, win rate, and cycle length into one number. However, all five must be segmented by lead source — inbound leads from LinkedIn authority content typically convert at 14.6% compared to 1.7% for outbound, making lead origin the most important variable across every metric.
How do you calculate pipeline velocity and why does it matter?
Pipeline velocity equals (Number of Qualified Opportunities x Average Deal Size x Win Rate) divided by Sales Cycle Length. It tells you how much revenue flows through your pipeline per day. This matters because it is the only metric that captures the interaction between pipeline volume, deal economics, conversion efficiency, and speed simultaneously. LinkedIn inbound leads improve all four variables — more qualified opportunities, larger deals from authority positioning, higher win rates from pre-built trust, and shorter cycles from pre-educated prospects — making inbound the most effective way to accelerate pipeline velocity.
What is a good cost per lead benchmark for LinkedIn in 2026?
LinkedIn cost per lead benchmarks in 2026 range from $15–50 for inbound engagement methods to $150–400 for cold automation approaches. However, CPL alone is misleading because it does not account for conversion quality. A $30 inbound lead converting at 14.6% produces a customer acquisition cost of approximately $200–400, while a $5 cold lead converting at 1.7% results in a CAC of $3,000–8,000. The accurate benchmark to target is cost per customer, not cost per lead, which makes inbound dramatically more efficient.
How does lead source quality affect sales metrics across the entire funnel?
Lead source quality cascades through every sales metric in the funnel. Inbound leads — particularly those from LinkedIn authority content — enter with higher intent, better qualification, and pre-built trust. This produces 2–3x higher lead-to-opportunity ratios (25–40% vs. 10–15%), 40–60% shorter sales cycles, 70% higher close rates, and 15–30% larger average deal sizes. Downstream, inbound customers also show 20–30% higher lifetime value and 50–60% lower churn rates because they purchased with realistic expectations formed through your content rather than a persuasive sales pitch.
What sales KPIs should startups focus on versus enterprise sales teams?
Startups should prioritize CAC, MRR growth rate, and sales cycle length because cash efficiency and speed to revenue are survival metrics. Enterprise sales teams should focus on win rate, average deal size, and quota attainment because their challenge is competitive positioning and rep productivity at scale. Both should track pipeline velocity as their primary health indicator. Regardless of stage, segmenting metrics by lead source is essential — LinkedIn inbound leads improve performance for both startups (lower CAC, faster cycles) and enterprise teams (higher win rates, larger deals from authority positioning).
Ready to attract qualified leads on LinkedIn? Start your free trial and see the difference inbound makes.
The Dark Side of Vanity Metrics: How Overemphasizing Activity-Based KPIs Can Destroy Sales Team Morale
While it's tempting to focus on easy-to-track metrics like calls made, emails sent, or meetings booked, overemphasizing these activity-based KPIs can have a devastating impact on sales team morale. When teams are solely judged on activity metrics, they may feel pressured to prioritize quantity over quality, leading to burnout and a sense of disconnection from the actual sales process. Furthermore, this approach can create a culture of competition rather than collaboration, where individual sales reps are pitted against each other in a race to see who can generate the most activity. As a result, team members may start to game the system, inflating their numbers with low-quality interactions that don't actually drive revenue. To avoid this trap, it's essential to strike a balance between activity-based metrics and outcome-based metrics, like conversion rates and close rates. By doing so, sales teams can focus on meaningful interactions that drive real results, rather than just padding their numbers with empty activity.
Myth vs Reality: Debunking the Notion that All Inbound Leads Are Created Equal
One common misconception in the sales world is that all inbound leads are inherently high-quality and deserving of equal attention. However, this simply isn't true. While inbound leads do tend to have higher conversion rates than outbound leads, not all inbound leads are created equal. For example, a lead that comes in through a highly targeted and relevant piece of content is likely to be much more qualified than a lead that comes in through a generic blog post or social media ad. Additionally, leads that are further along in the buyer's journey, such as those who have downloaded an e-book or attended a webinar, are generally more sales-ready than those who have only just discovered your brand. To maximize the value of your inbound leads, it's essential to segment and prioritize them based on their level of engagement, relevance, and sales readiness. By doing so, you can ensure that your sales team is focusing on the most promising opportunities and avoiding wasted time and effort on unqualified leads.
The Advanced Art of Pipeline Velocity Optimization: A Deep Dive into the Four Key Variables
For experienced sales professionals, optimizing pipeline velocity is an advanced topic that requires a deep understanding of the complex interplay between different variables. At its core, pipeline velocity refers to the speed at which leads move through the sales funnel, from initial contact to closed deal. However, optimizing pipeline velocity involves more than just speeding up the sales process – it requires a nuanced understanding of the four key variables that drive pipeline velocity: lead volume, conversion rate, sales cycle length, and deal size. To truly master pipeline velocity optimization, sales teams must be able to analyze and adjust each of these variables in real-time, using data-driven insights to identify bottlenecks and areas for improvement. For example, if a sales team discovers that their conversion rate is being held back by a lengthy sales cycle, they may choose to invest in sales enablement tools or training to help reps move leads through the funnel more quickly. By taking a holistic and data-driven approach to pipeline velocity optimization, sales teams can unlock significant gains in revenue growth and efficiency.
The Hidden Cost of Over-Relying on LinkedIn Inbound Leads: A Cautionary Tale of Dependence and Diversification
While LinkedIn inbound leads can be a powerful driver of revenue growth, over-relying on this single channel can be a recipe for disaster. By putting all their eggs in one basket, sales teams can become vulnerable to changes in the LinkedIn algorithm, shifts in user behavior, or even unexpected outages or technical issues. Furthermore, an over-reliance on LinkedIn inbound leads can also lead to a lack of diversification in the sales funnel, making it difficult to adapt to changes in the market or respond to new opportunities. To avoid this trap, sales teams should prioritize diversification and experimentation, continually testing and refining their approach to inbound lead generation across multiple channels and platforms. By doing so, they can reduce their dependence on any one channel and ensure a steady flow of high-quality leads, regardless of what the future may hold.
The "It Depends" Factor: How Sales Metrics and KPIs Can Vary Wildly Depending on Industry, Company Size, and Sales Model
One of the most significant challenges in sales metrics and KPIs is the "it depends" factor – the fact that what works for one company or industry may not work for another. For example, a small business with a short sales cycle and low average deal size may prioritize metrics like conversion rate and sales cycle length, while a large enterprise with a long sales cycle and high average deal size may focus more on metrics like pipeline velocity and deal size. Similarly, companies with a transactional sales model may prioritize metrics like lead volume and close rate, while those with a consultative sales model may focus more on metrics like customer satisfaction and retention. To navigate this complexity, sales teams must be willing to experiment and adapt, continually refining their approach to sales metrics and KPIs based on their unique industry, company size, and sales model. By doing so, they can ensure that their metrics and KPIs are truly aligned with their business goals and drivers of revenue growth.
See How It Works
Watch how people get more LinkedIn leads with ConnectSafely


Related Articles